Who I am
Digital Media MA student at the University of Leeds
.jpeg)
Setting up my portfolio website helped me understand how digital spaces shape the way we present ourselves and our work. I learned how web templates can balance creativity with functionality, changing how information is structured and perceived online. This workshop also deepened my awareness of how design choices influence accessibility and user experience online.
Creating a web scrape helped me see how online content can be broken down into bits of data that show patterns and connections across different platforms. I realized how powerful these tools are for collecting large amounts of information, but also how much they miss when it comes to context or meaning beyond the code.
Using OutWit Hub and WebScraper.io helped me get a hands-on sense of how data lives beneath the surface of web pages. I learned how to pick out specific elements from the HTML and saw just how much information websites hold. It also made me appreciate how useful scraping can be for research, but also how tricky it can get when sites are inconsistent or when the data doesn’t load as expected. It also made me think more about the ethics like whether it’s right to collect data just because it’s publicly visible online.
Working on the “University-led Data Collection” Scenario 2 made me think about how data can reflect and even reinforce power dynamics in education. As my group designed a survey about how students use generative AI, I noticed how the way we define and categorize “digital engagement” can leave out certain experiences or voices. The readings by Crawford and D’Ignazio & Klein also helped me see how bias often starts in the way data is collected and labeled. It also made me more aware of the data I share on platforms like Copilot or ChatGPT, and how those systems use it to shape what I see and how I interact online.
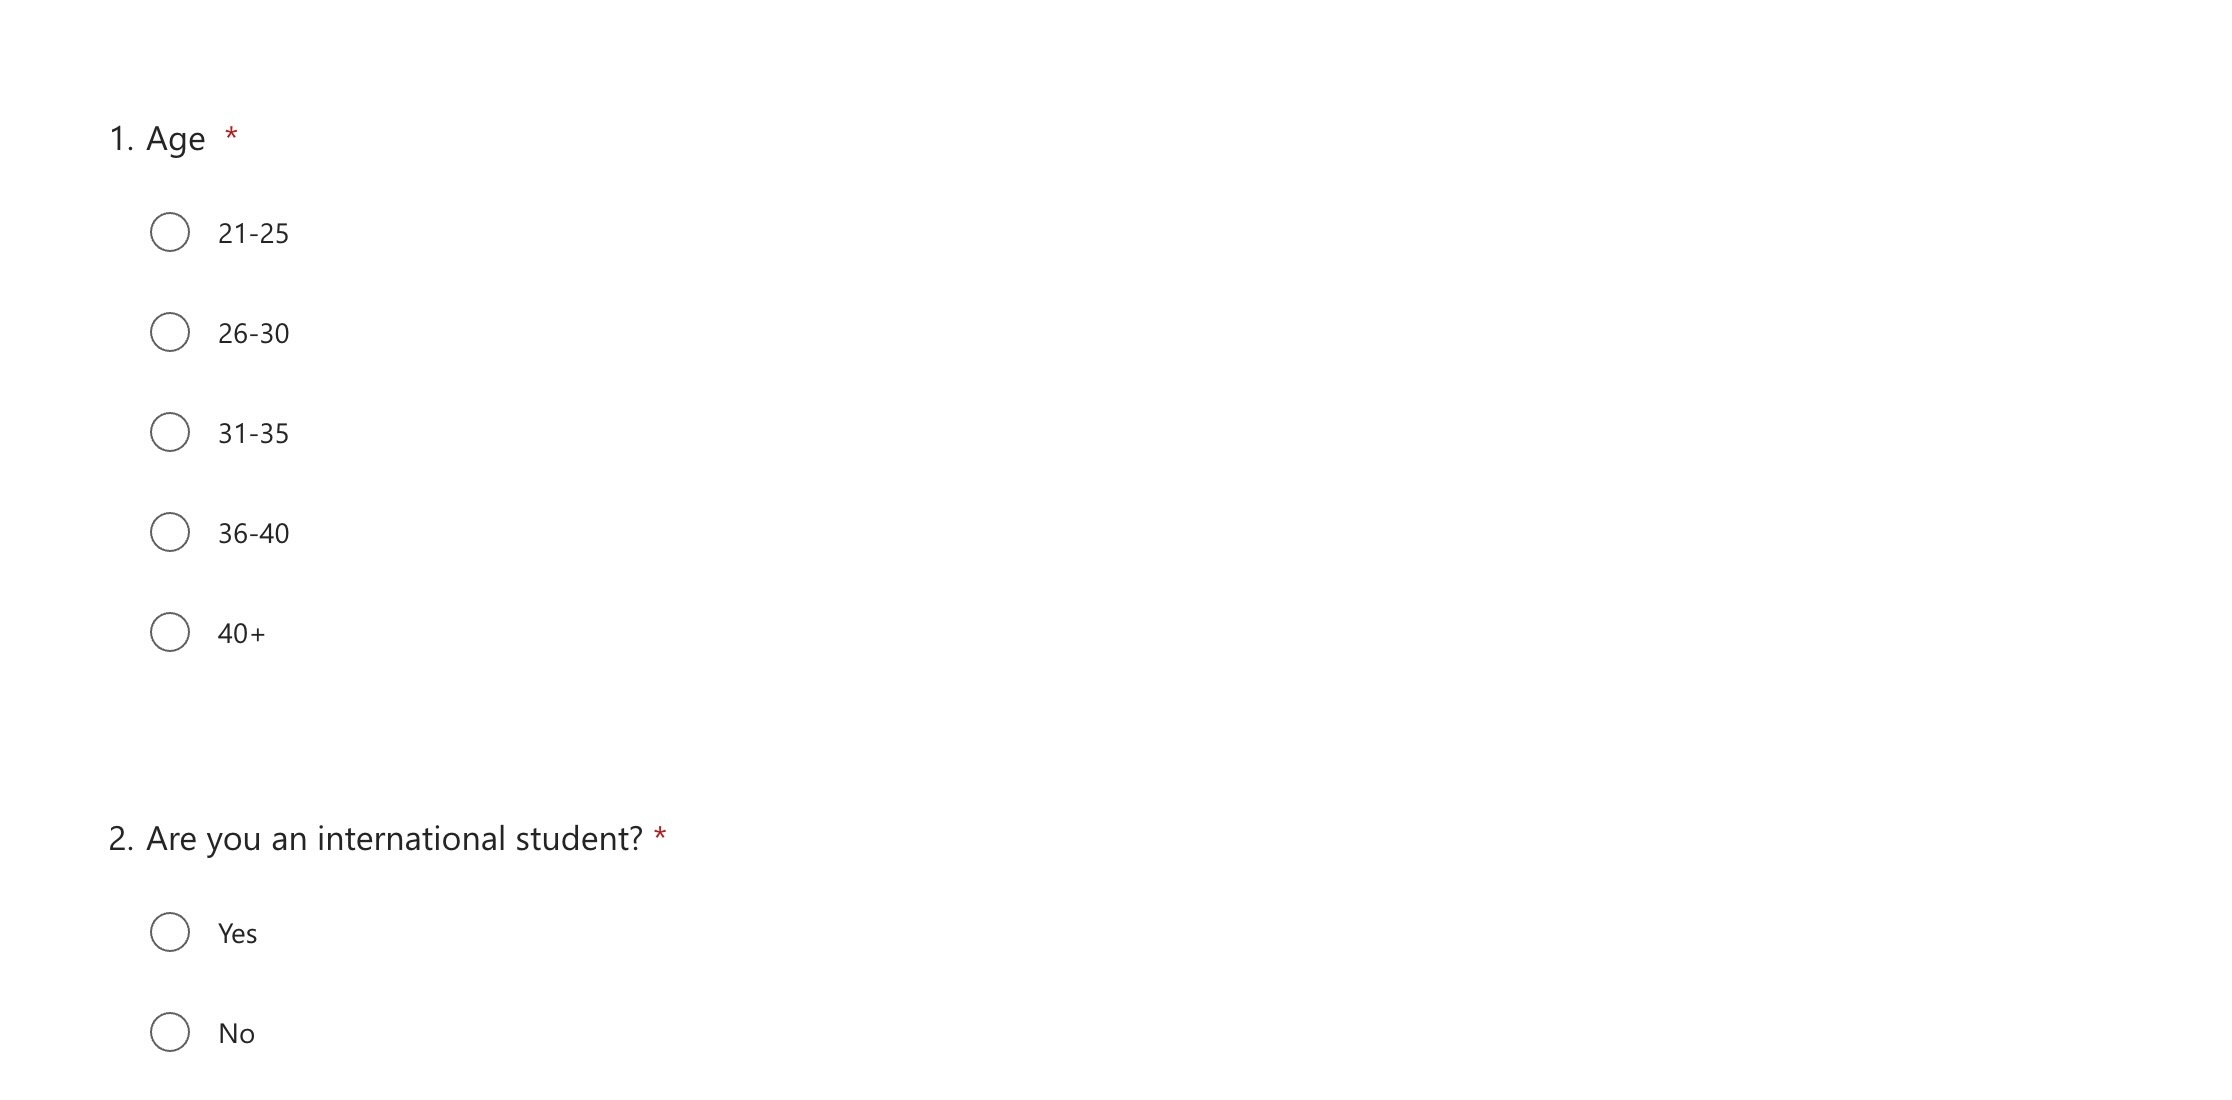
In this week’s workshop, our task was to take the survey data we collected on how students use generative AI and start visualizing it in Excel. The goal was to see how turning numbers into visuals can help make patterns easier to understand, but also to think about how our design choices shape what people take away from the data. Our group was assigned the second scenario option, which asked us to create a survey as if we were employed by a data analysis company working on behalf of a UK-university. Our goal was to better understand student digital engagement via data collection and analysis. Once we started working with our survey results, I realized the degree to which the way we worded questions affected how we could actually show results in the data visualizations. The full survey can be found at this link for reference.
A lot of responses used options like “somewhat likely” or “very likely,” and with multiple different generative AI tools and academic tasks included in our questionnaire, it was difficult to narrow down a way to present the answers concisely.
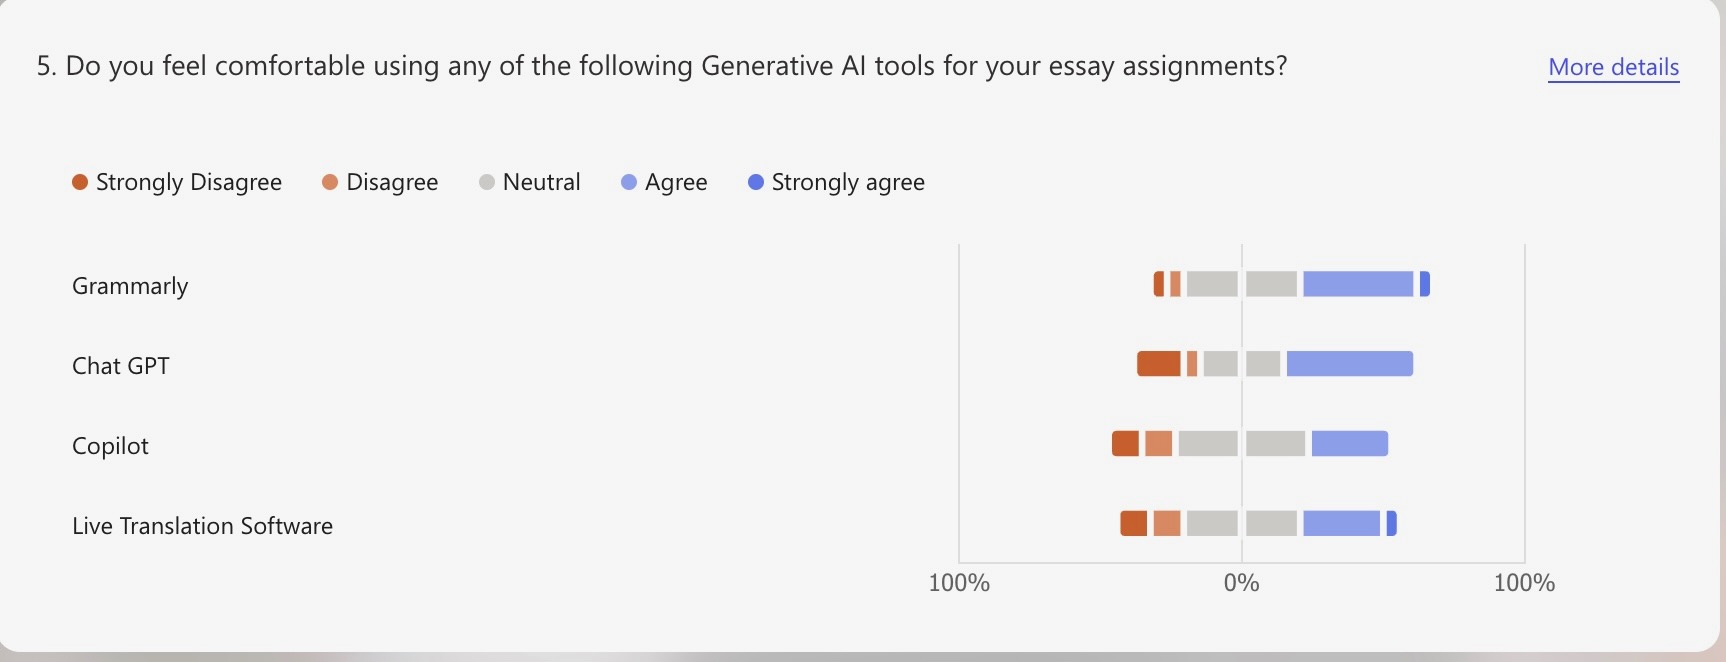
Something that stood out in the survey results was that students who answered seemed much more comfortable using AI for brainstorming or proofreading than for creative or critical work. It showed a potential boundary between where students may trust technology and where they still may rely on human input.
This made me think about how power and hierarchy show up in the ways data is collected and represented. Through the lens of feminist data visualization standpoint, it is possible that this data set left out certain categories and therefore left room for structural bias (D'Ignazio, C. and Klein, L.F. 2020). For examples, our group did not include the demographic question of gender in our survey. Feigenbaum, A. and Alamalhodaei, A. (2020) note that problems of bias can occur, especially “if the data being visualised does not include any demographic information about gender, then gender cannot be visualised at all.” This lack of data in the survey may have left room for bias based on overlooked demographics.
By viewing this workshop through a feminist lens, I can also recognize that there may be a specific power structure at play that influenced the survey response. Students may have been hesitant to reveal the actual extent of their AI usage since this survey was being sent by a UK University which they attended. It’s important to note that “all of the visual decisions that we make are influenced by existing cultural, social, and economic norms and practices” (Feigenbaum, A. and Alamalhodaei, A, 2020). international students especially may be cautious about adhering to the institution’s policies or may not know the full extent of policies (i.e., due to new cultural/academic norms, potential language/technological barriers), which could lower likelihood of their honest feedback.
This week made me think differently about what it means to experience computation. Munster’s reading pushed me away from seeing AI as something I use and toward understanding it as something shaped by ongoing processes and relations. Rather than feeling linear or responsive, computational experience started to feel layered and uncertain.
The negative prompting exercise made this especially clear. When I tried to guide the AI by saying what I did not want, it still drifted back to familiar tones and storylines. It was less about the AI failing and more about how strongly it defaults to patterns it has seen before, even when patterns do not quite fit what I was trying to express.
This made me think differently about identity in generative systems. It did not feel intentional, but something that slowly takes shape through repetition/omission. Working with the AI made me aware of how experiences can be simplified to fit what is predictable. The workshop left me thinking less about what AI can do, and more about what it struggles with.
Semester 1 helped me become more aware of how much digital systems shape everyday life in the background. A lot of the workshops encouraged me to slow down and question things I usually take for granted, like how platforms understand who we are, what data we share and how technology influences what we see and do online.
I was especially interested in the workshops around identity and algorithms. Looking at advertising profiles and experimenting with negative prompting made it clear how rough and incomplete algorithmic identities can be. They are built from patterns and assumptions rather than intention, and often feel quite far from how people understand themselves. These sessions made me more conscious of the amount of data being collected, including data I do not actively choose to share.
The digital ecologies workshop at Kirkgate Market stood out because it felt very grounded and hands on. Using my senses rather than focusing on screens made digital media feel much more connected to real places, people and forms of labour. It helped me think about technology as something that is embedded in wider systems, rather than something abstract or separate.
Going into the group project, I feel confident contributing ideas, critical reflection and research questions. I want to develop more confidence in turning those ideas into clear project outcomes and in working collaboratively to make decisions as a group. Overall, Semester 1 gave me a solid foundation and I am looking forward to building on it in Semester 2.